Tracing data
This page describes how to retrieve tracing data.
There are two kind of tracing data in Centiloc’s system:
- Geomapping of item taping (geomap page).
- Item’s full history (tracking page).
Your first connection to Dataui is described in previous section and is the same as Centui.
Let’s browse https://demo.dataui.centiloc.com, and log in with your configured account.
Changedemowith your tenant name.
Geomapping page displays the location of NFC taps. Depending on the matching labels attached to the NFC tag, the location displayed can have 3 colors:
- blue: configuration insufficient to conclude matching
- green: matching concluded to an expected tap
- red: matching concluded to an unexpected tap
As the location is usually done using a smartphone, the location displayed reflects the position of the mobile operator central.
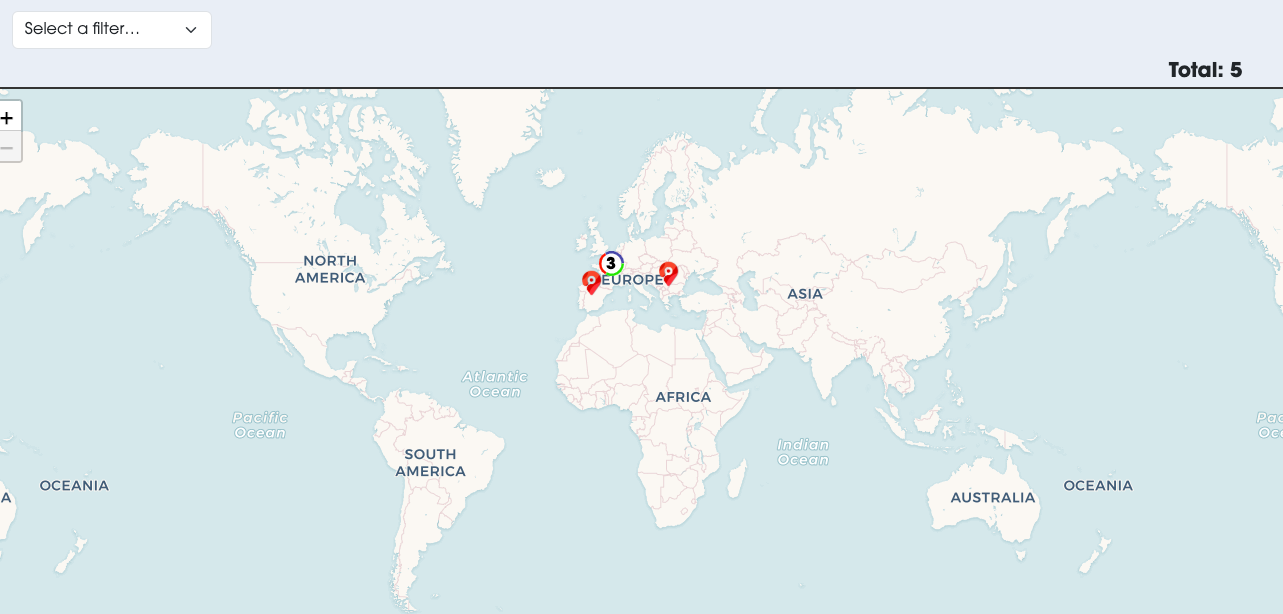
You can zoom in, out, drag and parse the map as any map application you can find in the internet.
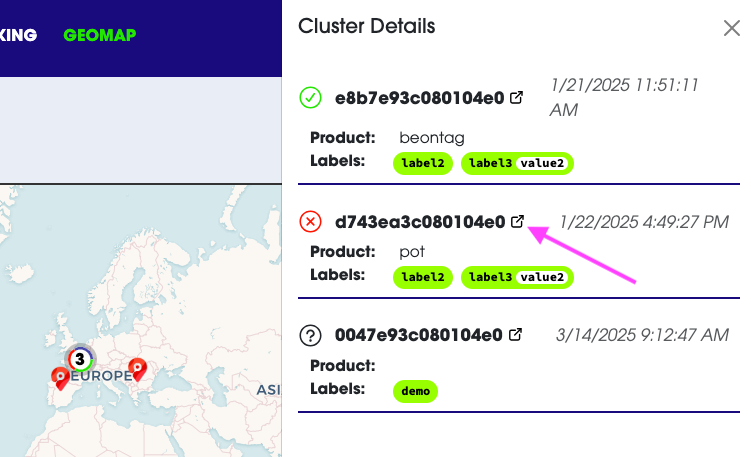
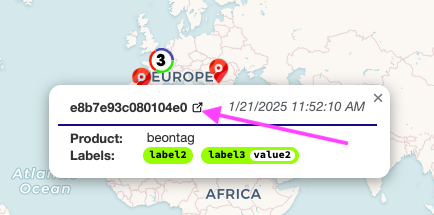
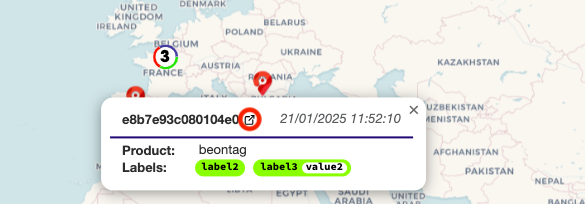
When selecting a tap, or a group of taps, you display general information about the NFC tag that has been tapped. You can then get more details by clicking the link icon and jumping to the tracking page.
As usual in Centiloc pages, you have access to filters to limit the number of icon displayed. Available filters are:
- UID: to see all the taps for a specific item
- product: to see all the taps of a specific product (assigned at enrolment)
- Item label: use a label expression to vizualize only a group of items.
- Status: to see taps which match ended up with UNKNOWN, OK or FAIL
The Tracking Page allows users to view the complete event history of an item in the system. Users can filter, sort, and explore different types of events related to an item.
You can access the tracking page directly from CentUI (version >1.11.0). To do so, simply click the ℹ icon next to the item’s UID:

You can access the tracking page directly from geomap page of Dataui. To do so, simply click a pin or a cluster. Then click on the icon next to the item’s UID:
If you know the UID of the item you can directly enter it in the page. Once you’ve filled the line, you can press Enter or the refresh button.

There are multiple ways to filter the history data. First off, you can select the type of event to display. There are 3 different types:
- Movements: tracks when the item was detected
IN/OUTof a CADS. - Enrolments: register the enrolments the item was part of.
- Tappings: tracks when the item was tapped on a phone.
You can show/hide some events by checking/unchecking the box next to the types at the top of the page:

You can reduce the number of events to fit a given timerange. This will filter out any event not in the specified timerange.
To add a timerange just click on the Add timespan button. Then you can select the start date and the end date.
Dates cannot be empty.

You can change the orientation of time, using the options below:

As stipulated:
- Newest First: displays the most recent events first
- Oldest First: shows the first events collected for the item first
When scrolling the events down, when you hit the bottom of the list, you can click
LOAD MOREbutton to get the next events
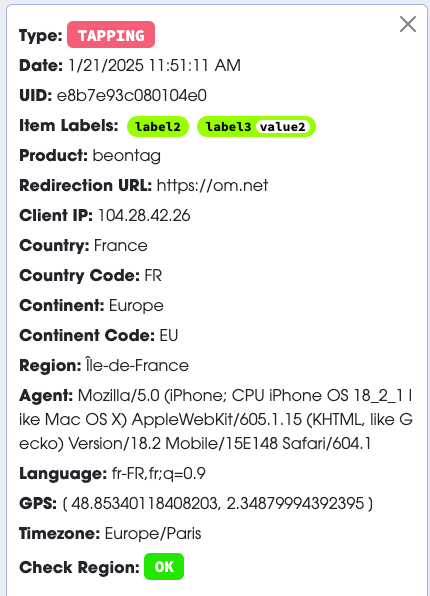
When selecting (=clicking) an event, you will open an detail pane:
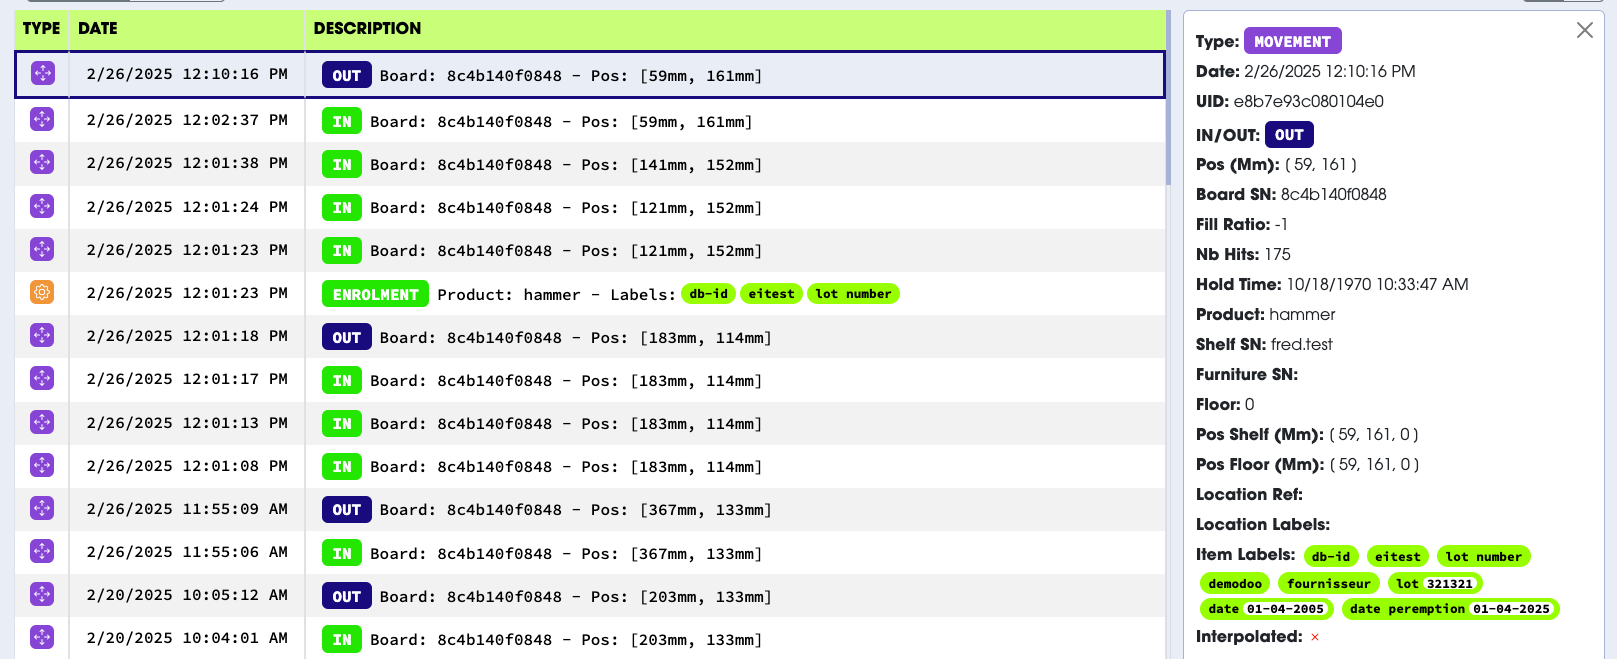
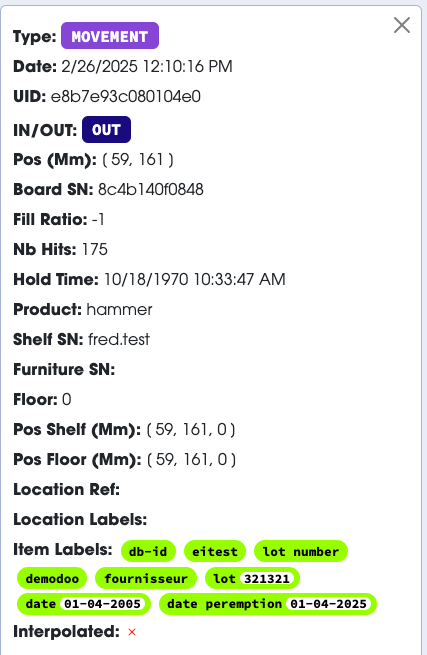
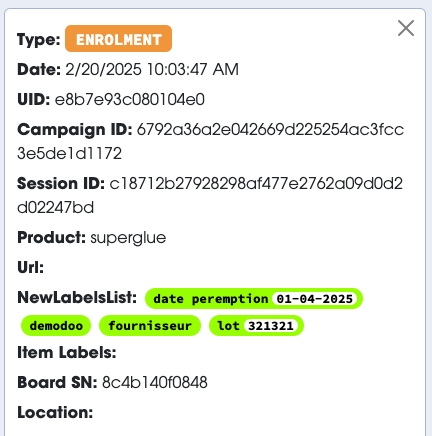
This view displays all the information we have about an event. The information displayed depends on the event selected:
- Movement: all the geolocation information, position, but also behavior data of the item (nb hits, hold time, fill ratio…)
- Enrolments: all the information about the enrolment operated: product assigned, labels applied…
- Tappings: all the geolocation and reaction of the tapping operated, source geolocation and matching conclusion
If you feel we should provide more details about the events description, please let us know
When select table view, you retrieve all columns from the different panes inside a single table.

While this view is not easy to read, it allows you to get a view of what will be generated in thecsvfile.
The table above can so be exported to csv file using the button below:

From here you can process any data or re-import in another system.
